washington commanders vs philadelphia eagles match player stats
Introduction: Washington Commanders vs Philadelphia Eagles Match Player Stats
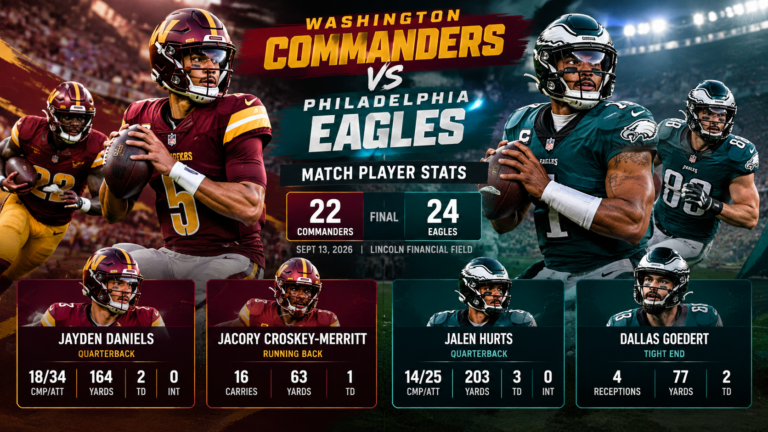
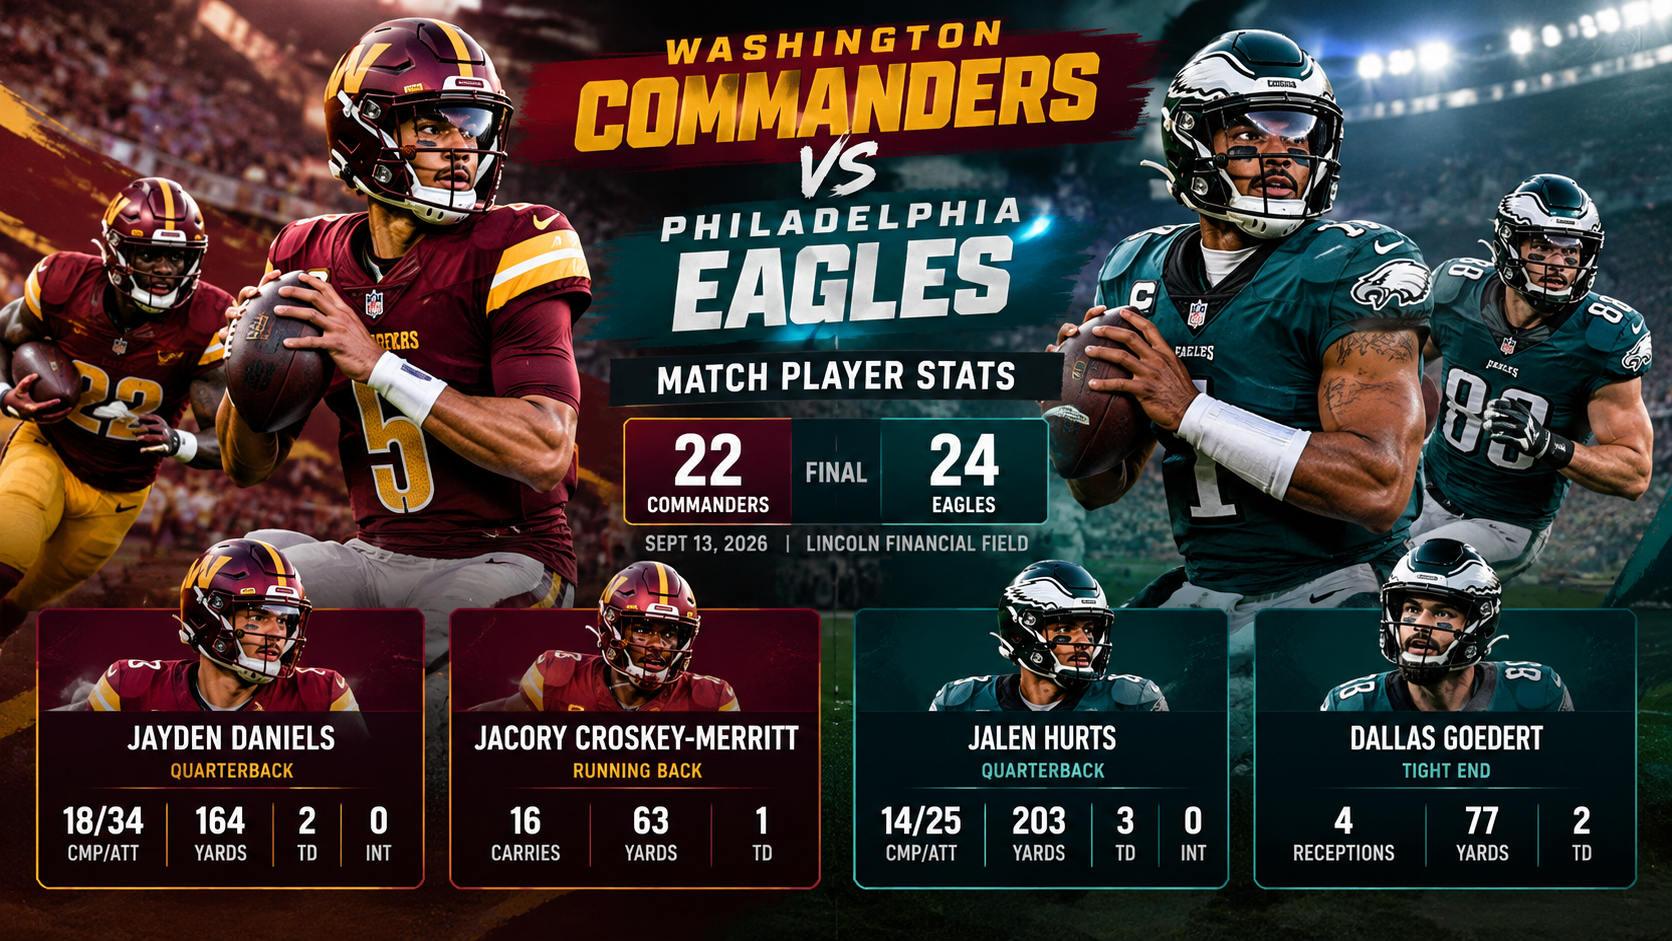
The Washington Commanders and the Philadelphia Eagles produced one of the tightest games of the opening weeks of the 2026 NFL season. Played on September 13, 2026, at Philadelphia, the game finished 24-22 in favor of the Eagles, but the margin hides how close Washington came to forcing overtime. This article walks through the washington commanders vs philadelphia eagles match player stats, from the scoring plays and the individual contributors to the full team-level numbers in easy-to-read tables.
A note on the data: the figures below come from the official game feed, which includes complete team statistics and a play-by-play list of every scoring play. It does not include individual rushing, receiving or tackling totals for each player, so those are not listed here. Where a number is not available, this article says so instead of guessing.
Table of Contents
Match Overview
Before going into the player-level details, here is the basic picture of the game.
Game Details at a Glance
| Detail | Information |
|---|---|
| Matchup | Washington Commanders (away) vs Philadelphia Eagles (home) |
| Date | September 13, 2026 |
| Kickoff | 20:25 UTC (4:25 PM ET) |
| Status | Final |
| Final score | Eagles 24, Commanders 22 |
| Winning margin | 2 points |
| Turnovers | 0 for both teams |
| Total touchdowns | 3 for each team |
Score by Quarter
The quarter-by-quarter scoring shows a game that swung from a Washington field goal to an Eagles surge in the second quarter, and then to a frantic fourth quarter in which both teams scored.
| Team | Q1 | Q2 | Q3 | Q4 | Final |
|---|---|---|---|---|---|
| Washington Commanders | 3 | 6 | 0 | 13 | 22 |
| Philadelphia Eagles | 0 | 14 | 3 | 7 | 24 |
The Commanders scored first and finished strong, but their 9 points before halftime and zero points in the third quarter left them chasing for most of the afternoon. The Eagles scored 14 points in the second quarter alone, which turned out to be the difference in the game.
How the Game Unfolded
Washington opened the scoring with a 55-yard field goal in the first quarter. Philadelphia answered in the second quarter with two touchdown passes from Jalen Hurts, first to Dallas Goedert and then to D. Wicks, to lead 14-3. Washington cut the gap right before halftime on a one-yard rushing touchdown by J. Croskey-Merritt, although the extra point was blocked, so the score stood at 14-9.
The Eagles added a 35-yard field goal in the third quarter to go up 17-9. In the fourth quarter, Jayden Daniels found Stefon Diggs for a 10-yard touchdown to make it 17-16 after the extra point. Hurts and Goedert then connected again, this time for 43 yards, and the Eagles led 24-16. Washington got one more touchdown, a one-yard pass from Daniels to A. Williams with 1:05 left, which was upheld after a replay review. The two-point conversion attempt to J. Bates failed, and the Eagles held on.
Scoring Summary: Every Scoring Play
The table below lists all eight scoring drives in order, with the running score after each.
| # | Quarter | Team | Scoring Play | Score After |
|---|---|---|---|---|
| 1 | Q1 | Commanders | D. Stevens 55-yard field goal | PHI 0, WAS 3 |
| 2 | Q2 | Eagles | J. Hurts to D. Goedert, 17-yard TD (J. Elliott extra point good) | PHI 7, WAS 3 |
| 3 | Q2 | Eagles | J. Hurts to D. Wicks, 9-yard TD (J. Elliott extra point good) | PHI 14, WAS 3 |
| 4 | Q2 | Commanders | J. Croskey-Merritt 1-yard rush TD (D. Stevens extra point blocked) | PHI 14, WAS 9 |
| 5 | Q3 | Eagles | J. Elliott 35-yard field goal | PHI 17, WAS 9 |
| 6 | Q4 | Commanders | J. Daniels to S. Diggs, 10-yard TD (D. Stevens extra point good) | PHI 17, WAS 16 |
| 7 | Q4 | Eagles | J. Hurts to D. Goedert, 43-yard TD (J. Elliott extra point good) | PHI 24, WAS 16 |
| 8 | Q4 | Commanders | J. Daniels to A. Williams, 1-yard TD (two-point attempt to J. Bates fails) | PHI 24, WAS 22 |
Every point in the game came from one of these eight plays, so the table is also the simplest way to see who produced the offense on each side.
Philadelphia Eagles Player Stats
Jalen Hurts: Efficient and Explosive
Hurts threw all three of Philadelphia’s touchdowns. The Eagles’ team passing line shows 14 completions on 25 attempts (56.0 percent) for 203 yards, three touchdowns and no interceptions, which works out to a passer rating of 122.2. The longest completion of the game was a 64-yarder, and the average gain per completion was 14.5 yards.
Those numbers show a quarterback who did not need volume to be effective. Hurts attempted only 25 passes, yet the Eagles averaged 6.5 yards per attempt and created chunk plays when it counted. He was also sacked three times for 21 yards, so his net passing yardage was 182. The Eagles also recorded four quarterback scrambles, which helped extend drives against a Washington defense that blitzed heavily.
Dallas Goedert: Two Touchdowns, 60 Scoring Yards
Goedert was the clear scoring leader among the pass catchers in this game. He caught touchdown passes of 17 yards in the second quarter and 43 yards in the fourth quarter, giving him 60 yards on his two scoring receptions alone. The 43-yard score came with about six minutes left and pushed the lead to seven points at a critical moment.
The 43-yard catch was also the Eagles’ longest touchdown through the air. The team’s longest completion overall was 64 yards, and the Eagles gained 65 of their 203 receiving yards after the catch.
D. Wicks: The 9-Yard Touchdown
D. Wicks caught a short touchdown pass from Hurts late in the second quarter. That score gave the Eagles a 14-3 lead and, combined with Goedert’s score, produced the 14-point second quarter that proved decisive.
J. Elliott and the Kicking Game
The Eagles’ kicker, J. Elliott, converted every attempt: a 35-yard field goal and all three extra points, for six points in total. Philadelphia’s punting was also strong, with seven punts for 361 yards (a 51.6-yard average), a 44.0-yard net average and four punts landing inside the 20-yard line. The longest punt traveled 64 yards.
Eagles Rushing Attack
The Eagles ran 25 times for 136 yards, an average of 5.44 yards per carry, with a longest run of 42 yards. They did not score a rushing touchdown. Of those yards, 85 came after contact, which shows how physical the run game was. Individual carry totals are not part of the available feed, so the split between ball carriers is not listed.
Eagles Defense and Special Teams
Philadelphia’s defense recorded 62 combined tackles (34 solo and 28 assisted), one sack, two quarterback hits, two passes defended and one forced fumble. The defense blitzed 23 times and forced five three-and-outs. The special teams unit added seven tackles and one block.
Washington Commanders Player Stats
Jayden Daniels: Two Touchdowns in the Comeback Push
Daniels threw both of Washington’s touchdown passes, a 10-yarder to Diggs and a one-yarder to A. Williams. The Commanders’ passing line was 18 of 34 (52.9 percent) for 164 yards, two touchdowns and no interceptions, with a passer rating of 85.9. He was sacked only once for a single yard.
The yardage per attempt was low at 4.66, and the longest completion was 33 yards. Washington’s air yards totaled just 93, compared with 138 for Philadelphia, which means the offense relied on short throws and yards after the catch (71 of the 164 receiving yards).
Stefon Diggs: The Fourth-Quarter Spark
Diggs caught the 10-yard touchdown that started Washington’s fourth-quarter rally. The score cut the lead to one point after the extra point and changed the pressure on Philadelphia’s offense. The Commanders’ longest touchdown reception of the day was this 10-yard play.
J. Croskey-Merritt: The Goal-Line Back
Croskey-Merritt scored Washington’s only rushing touchdown on a one-yard run just before halftime. The Commanders ran the ball 32 times for 132 yards (4.1 per carry) and earned nine rushing first downs. Their longest run was only 14 yards, which shows a steady but not explosive ground game.
A. Williams and J. Bates
Williams caught the one-yard touchdown with 1:05 left that brought Washington within two points, and the play was upheld after a replay review. Bates was the target on the two-point attempt that would have tied the game. The pass was unsuccessful, and it ended up being the deciding play of the contest.
D. Stevens: A Long Kick and Costly Misses
Stevens made a 55-yard field goal in the first quarter, which was the longest kick of the game. However, Washington attempted two field goals, both from 50 yards or more, and made only one of them. A blocked extra point after the Croskey-Merritt touchdown also cost a point. Special-teams issues played a real role in the two-point final margin.
Commanders Defense
Washington’s defense was disruptive. It produced three sacks for 21 yards, five quarterback hits and 10 tackles for loss, and it forced five three-and-outs. It blitzed 31 times, the highest number in the game. Combined tackles totaled 48 (26 solo and 22 assisted), with two passes defended and one batted pass.
Player Contribution Summary
The table below collects every player who appears in the scoring plays, along with what they did.
| Player | Team | Contribution |
|---|---|---|
| Jalen Hurts | Eagles | 3 touchdown passes (17, 9 and 43 yards) |
| Dallas Goedert | Eagles | 2 touchdown catches (17 and 43 yards) |
| D. Wicks | Eagles | 1 touchdown catch (9 yards) |
| J. Elliott | Eagles | 1 of 1 field goals (35 yards), 3 extra points |
| Jayden Daniels | Commanders | 2 touchdown passes (10 and 1 yards), 1 failed two-point attempt |
| Stefon Diggs | Commanders | 1 touchdown catch (10 yards) |
| A. Williams | Commanders | 1 touchdown catch (1 yard) |
| J. Croskey-Merritt | Commanders | 1 rushing touchdown (1 yard) |
| D. Stevens | Commanders | 1 field goal (55 yards), 1 field goal missed, 1 extra point made, 1 extra point blocked |
| J. Bates | Commanders | Target on the failed two-point conversion |
Full Team Statistics Comparison
Overall Offense
| Statistic | Commanders | Eagles |
|---|---|---|
| Total yards | 295 | 318 |
| Total plays | 67 | 53 |
| Average gain per play | 4.4 | 6.0 |
| Time of possession | 33:20 | 26:40 |
| First downs | 20 | 10 |
| First downs by pass | 10 | 6 |
| First downs by rush | 9 | 4 |
| First downs by penalty | 1 | 0 |
| Turnovers | 0 | 0 |
| Fumbles (lost) | 1 (0) | 0 (0) |
| Penalties (yards) | 6 (45) | 5 (40) |
Passing
| Statistic | Commanders | Eagles |
|---|---|---|
| Completions / attempts | 18 / 34 | 14 / 25 |
| Completion percentage | 52.9% | 56.0% |
| Passing yards | 164 | 203 |
| Yards per attempt | 4.66 | 6.5 |
| Touchdowns | 2 | 3 |
| Interceptions | 0 | 0 |
| Passer rating | 85.9 | 122.2 |
| Sacks taken (yards) | 1 (1) | 3 (21) |
| Net passing yards | 163 | 182 |
| Longest completion | 33 | 64 |
| Air yards | 93 | 138 |
| Throwaways | 5 | 3 |
| Poor throws | 5 | 5 |
| Dropped passes | 4 | 1 |
| Blitzes faced | 7 | 12 |
Rushing
| Statistic | Commanders | Eagles |
|---|---|---|
| Attempts | 32 | 25 |
| Rushing yards | 132 | 136 |
| Yards per carry | 4.13 | 5.44 |
| Rushing touchdowns | 1 | 0 |
| Longest run | 14 | 42 |
| Rushing first downs | 9 | 4 |
| Yards after contact | 58 | 85 |
| Broken tackles | 2 | 2 |
| Red zone rushing attempts | 7 | 3 |
Receiving
| Statistic | Commanders | Eagles |
|---|---|---|
| Targets | 29 | 22 |
| Receptions | 18 | 14 |
| Receiving yards | 164 | 203 |
| Yards per reception | 9.1 | 14.5 |
| Touchdown receptions | 2 | 3 |
| Yards after catch | 71 | 65 |
| Longest reception | 33 | 64 |
| Red zone targets | 6 | 3 |
| Dropped passes | 4 | 1 |
Special Teams
| Statistic | Commanders | Eagles |
|---|---|---|
| Field goals | 1 of 2 (long 55) | 1 of 1 (long 35) |
| Punts | 6 | 7 |
| Punting yards | 318 | 361 |
| Average punt | 53.0 | 51.6 |
| Net average | 43.5 | 44.0 |
| Punts inside the 20 | 0 | 4 |
| Punt returns (yards) | 4 (53) | 4 (37) |
| Kick returns (yards) | 5 (154) | 3 (75) |
| Average kick return | 30.8 | 25.0 |
Defense
| Statistic | Commanders | Eagles |
|---|---|---|
| Combined tackles | 48 | 62 |
| Solo tackles | 26 | 34 |
| Assisted tackles | 22 | 28 |
| Sacks | 3.0 | 1.0 |
| Quarterback hits | 5 | 2 |
| Tackles for loss | 10 | 2 |
| Passes defended | 2 | 2 |
| Forced fumbles | 0 | 1 |
| Blitzes | 31 | 23 |
| Hurries | 4 | 6 |
| Three-and-outs forced | 5 | 5 |
| Missed tackles | 8 | 8 |
What the Numbers Really Say
Efficiency Beat Volume
The most striking contrast is how differently the two offenses produced their yards. Washington ran 67 plays and held the ball for 33:20, but averaged only 4.4 yards per play. Philadelphia ran just 53 plays and had the ball for 26:40, but averaged 6.0 yards per play. The Eagles finished with more total yards (318 to 295) despite 14 fewer snaps. Washington also earned twice as many first downs (20 to 10), but the Eagles turned a smaller number of successful plays into bigger gains.
Explosive Plays Decided the Game
Philadelphia’s longest run was 42 yards and its longest pass was 64 yards. Washington’s longest run was 14 yards and its longest pass was 33. Plays of that size are rare, and they gave the Eagles a major advantage in field position and scoring. Goedert’s 43-yard touchdown in the fourth quarter is the best example of a big play arriving at the exact moment a team needed it.
Washington’s Missed Points
The final margin was two points, and Washington left more than that on the field. A missed field goal, a blocked extra point and a failed two-point conversion all took points off the board. Had the final two-point try succeeded, the game would have been tied at 24-24. In a game this tight, special teams and short-yardage execution carried as much weight as any single offensive play.
Red Zone Opportunities
The Commanders were in scoring territory often. They had 7 rushing attempts and 8 pass attempts in the red zone, 15 plays in total, and they scored three touchdowns, two of them from the one-yard line. Philadelphia had only three rushing attempts and three pass attempts in the red zone, yet scored three touchdowns through the air. The Eagles were more efficient with fewer chances.
Pass Rush and Pressure
Washington’s defense sacked Hurts three times and hit him five times, and it blitzed 31 times. Philadelphia sacked Daniels only once and blitzed 23 times. On paper, Washington won the battle at the line of scrimmage, but Hurts still produced three touchdowns and a 122.2 rating. The Eagles’ quarterback handled pressure well, with an average pocket time of 2.6 seconds and only one batted pass.
Discipline and Ball Security
Neither team turned the ball over, and penalties were nearly even (six for 45 yards for Washington and five for 40 yards for Philadelphia). Washington’s receivers dropped four passes against one for Philadelphia, which may have kept the Commanders from converting more of their drives into points. In a one-possession game, dropped passes can matter as much as turnovers.
Season Context for the Commanders
This game was the first of Washington’s 2026 season. Based on the results in the current schedule, the Commanders followed it with a 37-20 loss at Dallas, a 33-31 win at home over Seattle and a 30-13 home loss to Indianapolis, leaving them at 1-3 after four weeks.
| Date | Opponent | Result |
|---|---|---|
| September 13 | at Philadelphia Eagles | L 22-24 |
| September 20 | at Dallas Cowboys | L 20-37 |
| September 27 | vs Seattle Seahawks | W 33-31 |
| October 4 | vs Indianapolis Colts | L 13-30 |
| October 11 | vs New York Giants | Scheduled |
The opening loss to Philadelphia was the closest of Washington’s three defeats, and the box score shows a team that was competitive but undone by small details.
The Rematch: Sunday Night Football on November 1
The two teams meet again on Sunday Night Football, this time in Washington. The game kicks off at 8:20 PM ET on November 1, which is 6:50 AM on Monday, November 2 in India. The first meeting gives a clear set of questions for the rematch.
What to Watch in the Rematch
| Question | Why it matters |
|---|---|
| Can Washington finish drives? | The Commanders had 15 red zone plays in the first game but left points on the field. |
| Can the Eagles keep creating big plays? | Their 64-yard pass and 42-yard run drove the win. |
| Will special teams decide it again? | The blocked extra point, missed field goal and failed two-point try were all costly. |
| Can Washington protect against explosive passes? | Hurts averaged 14.5 yards per completion. |
| Which quarterback handles pressure better? | Both teams blitzed heavily. |
Frequently Asked Questions
Who won the Washington Commanders vs Philadelphia Eagles game?
The Philadelphia Eagles won 24-22 on September 13, 2026, at home.
Who scored the touchdowns in the game?
For Philadelphia, Dallas Goedert caught two touchdown passes (17 and 43 yards) and D. Wicks caught one (9 yards), all from Jalen Hurts. For Washington, Stefon Diggs (10 yards) and A. Williams (1 yard) caught touchdown passes from Jayden Daniels, and J. Croskey-Merritt scored on a one-yard run.
Did either team turn the ball over?
No. Both teams finished with zero turnovers. Washington had one fumble but recovered it.
Why did Washington lose despite more yards of possession?
The Commanders held the ball longer and had more first downs, but they averaged only 4.4 yards per play, missed a field goal, had an extra point blocked and failed a two-point conversion. The Eagles had bigger plays and were more efficient in the red zone.
How many sacks were there?
Washington sacked Hurts three times for 21 yards, and Philadelphia sacked Daniels once for one yard.
When do the two teams play again?
They meet on Sunday Night Football in Washington on November 1, with kickoff at 8:20 PM ET.
Conclusion
The washington commanders vs philadelphia eagles match player stats tell the story of a close game decided by explosiveness and execution. Jalen Hurts and Dallas Goedert supplied the big plays, Jayden Daniels led a late charge with two fourth-quarter touchdown passes, and a handful of small special-teams mistakes kept Washington one successful conversion short of a tie. With the rematch set for November 1, the first game offers a useful guide to what each team needs to fix and what each will try to repeat.
Data note: statistics in this article come from the official game feed. Individual rushing, receiving and tackling totals for each player are not included in that feed and are therefore not listed.
About the Author